Home COVID-19 COVID-19 data

COVID-19 data

0
COVID-19 data

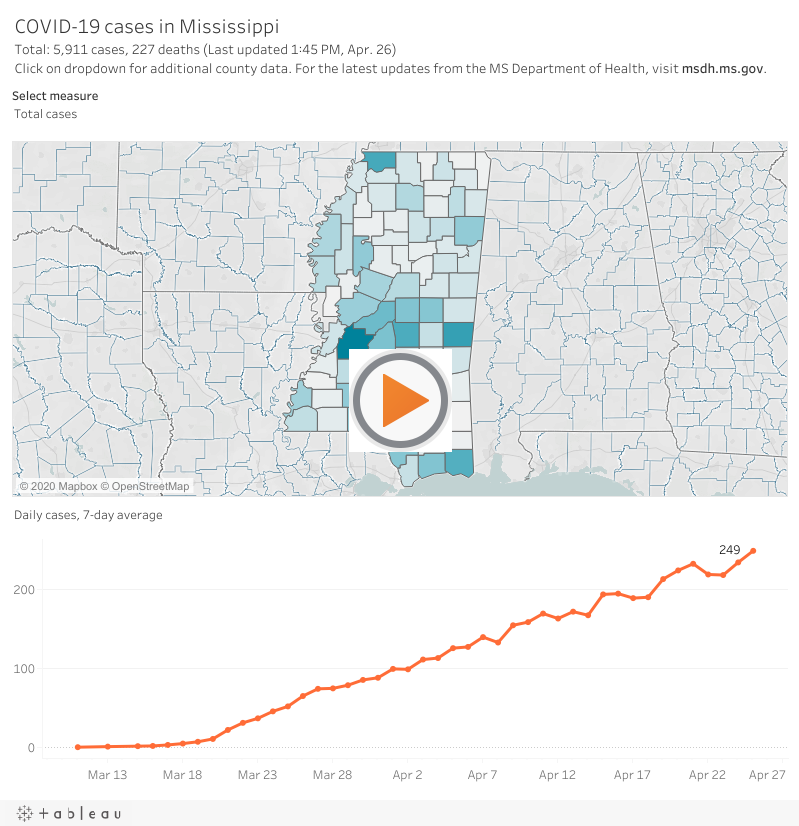
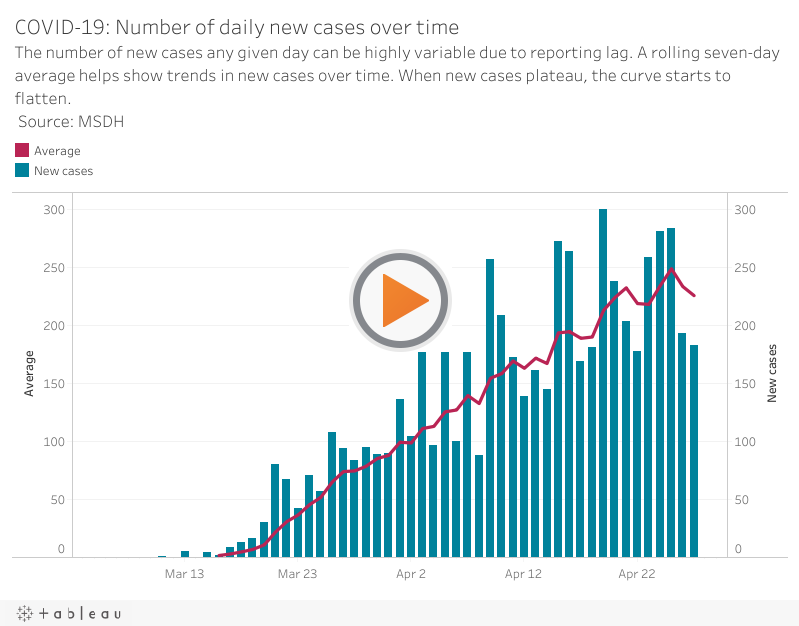
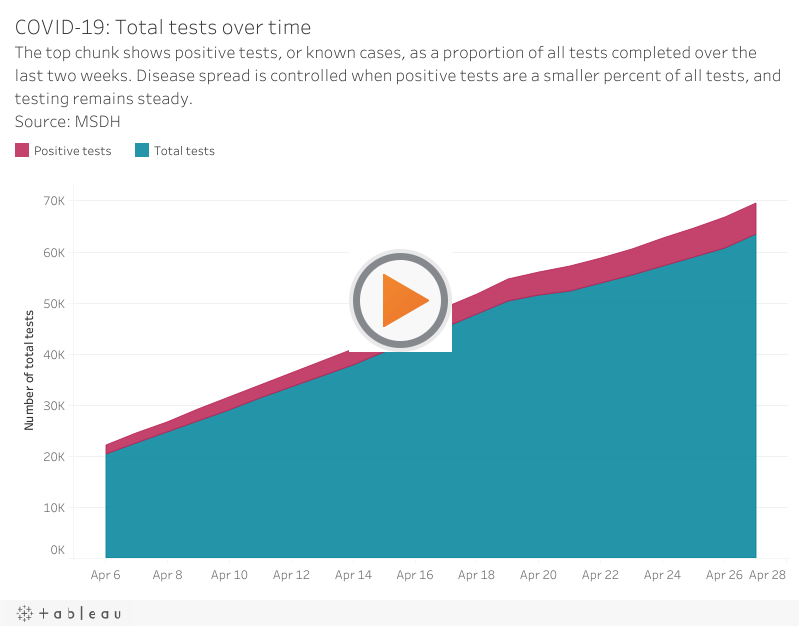
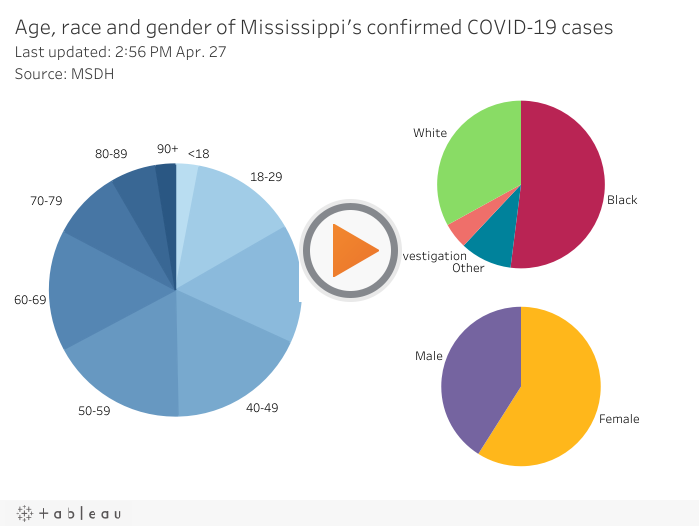
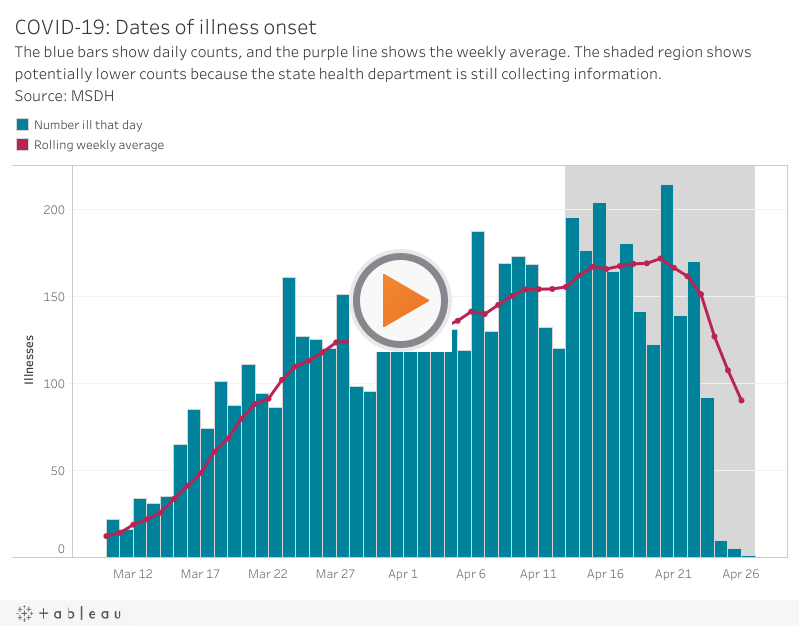
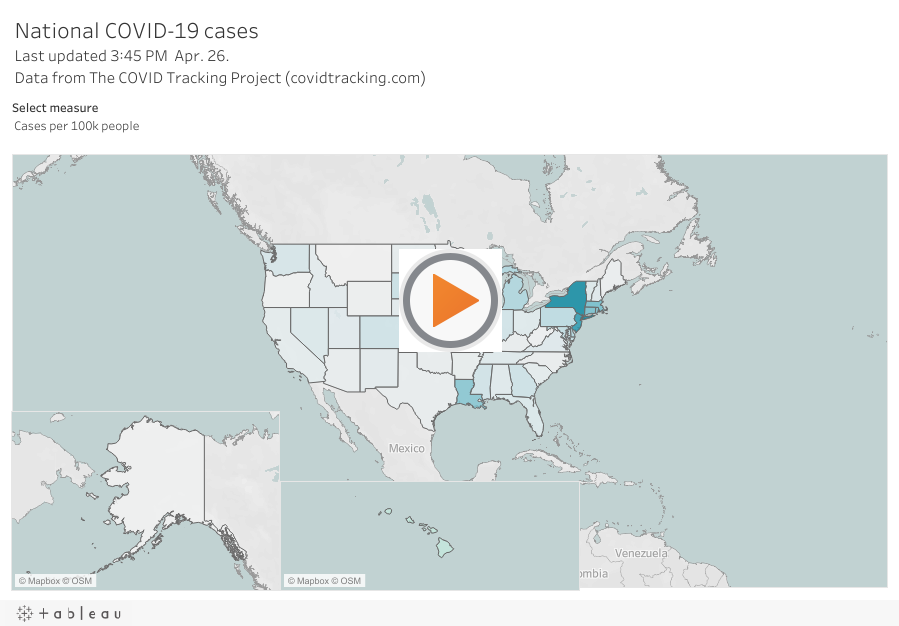
Click on the above links or scroll down to view our interactive charts describing the trends around the coronavirus in Mississippi.

Cases by county

Daily new cases over time

The total count of cumulative cases will never decrease unless the disease is eradicated — that’s not a likely scenario, nor used by experts to gauge disease spread. But, multiple daily counts can indicate when the curve is “flattening,” signaling that all cases are plateauing. Since cases began to grow exponentially in the U.S., the public health goal has largely revolved around mitigating spread and preparing for potential patient surge by bulking up the health care system. In theory, if the former — reducing spread through social distancing — succeeds, the latter — overtaxing the healthcare system — becomes less of a threat. Essentially, if public health strategies work, worst-case-scenario preparations become less necessary.

Total tests over time

Both the number of new and all cases are a function of testing — the more tests completed, the more cases are identified, traced and, ideally, isolated. Mississippi has been and continues to be ahead of the national curve for testing, according to nationwide data aggregated by The COVID Tracking Project. Daily analysis puts Mississippi around between 12th and 15th most total tests per capita in the nation. But daily tests, according to the data available from the health department, have begun to decline. Averaged over the last two weeks the daily test count has decreased slightly in the last few days. A new Harvard study suggests states should reach 152 daily tests per 100,000 people to have a safe barometer of statewide COVID identification. Over the last full week of April, Mississippi averaged about 2,000 tests per day, or 71 per 100,000. On April 27, the health department loosened testing guidelines for state-sponsored testing pop-ups, aiming to increase testing coverage for those who’ve been exposed to the virus or are showing light symptoms, no longer exclusive to those with fevers.

Age, race and gender of confirmed cases

Dates of illness onset

Illness onset refers to the date when a patient with a confirmed case actually started getting sick. The metric can offer a better trend gauge than number of new cases due to reporting delay, but has its own shortcomings because most, but not all, known cases are reported.

Up until the last full week in April, the number of COVID illnesses starting on any given day peaked on April 6 with 174 people reported first having symptoms. Since then, the peak has moved toward the tail of the graph, meaning more recent, and jumped higher — in addition to clustering with other high points. As of the last weekend in April, for the first time, this chart shows most cases ever in the past few days, on April 20 at 214, and the two next highest points in the last two weeks as well — a departure from previous trends. Both single day reports and averaging the number of illnesses weekly show variability without a steady downward trend.

National COVID-19 cases

View our COVID-19 resource page for more information about coronavirus in Mississippi.

The post COVID-19 data appeared first on Mississippi Today.

Mississippi Today